See climate risk before it reaches your portfolio.
Province-level climate and drought risk intelligence
Neta Alert brings rainfall, soil moisture, drought pressure and water access into one province-level view, so you can compare conditions and review the evidence before you approve a loan, price a policy or commit a budget.
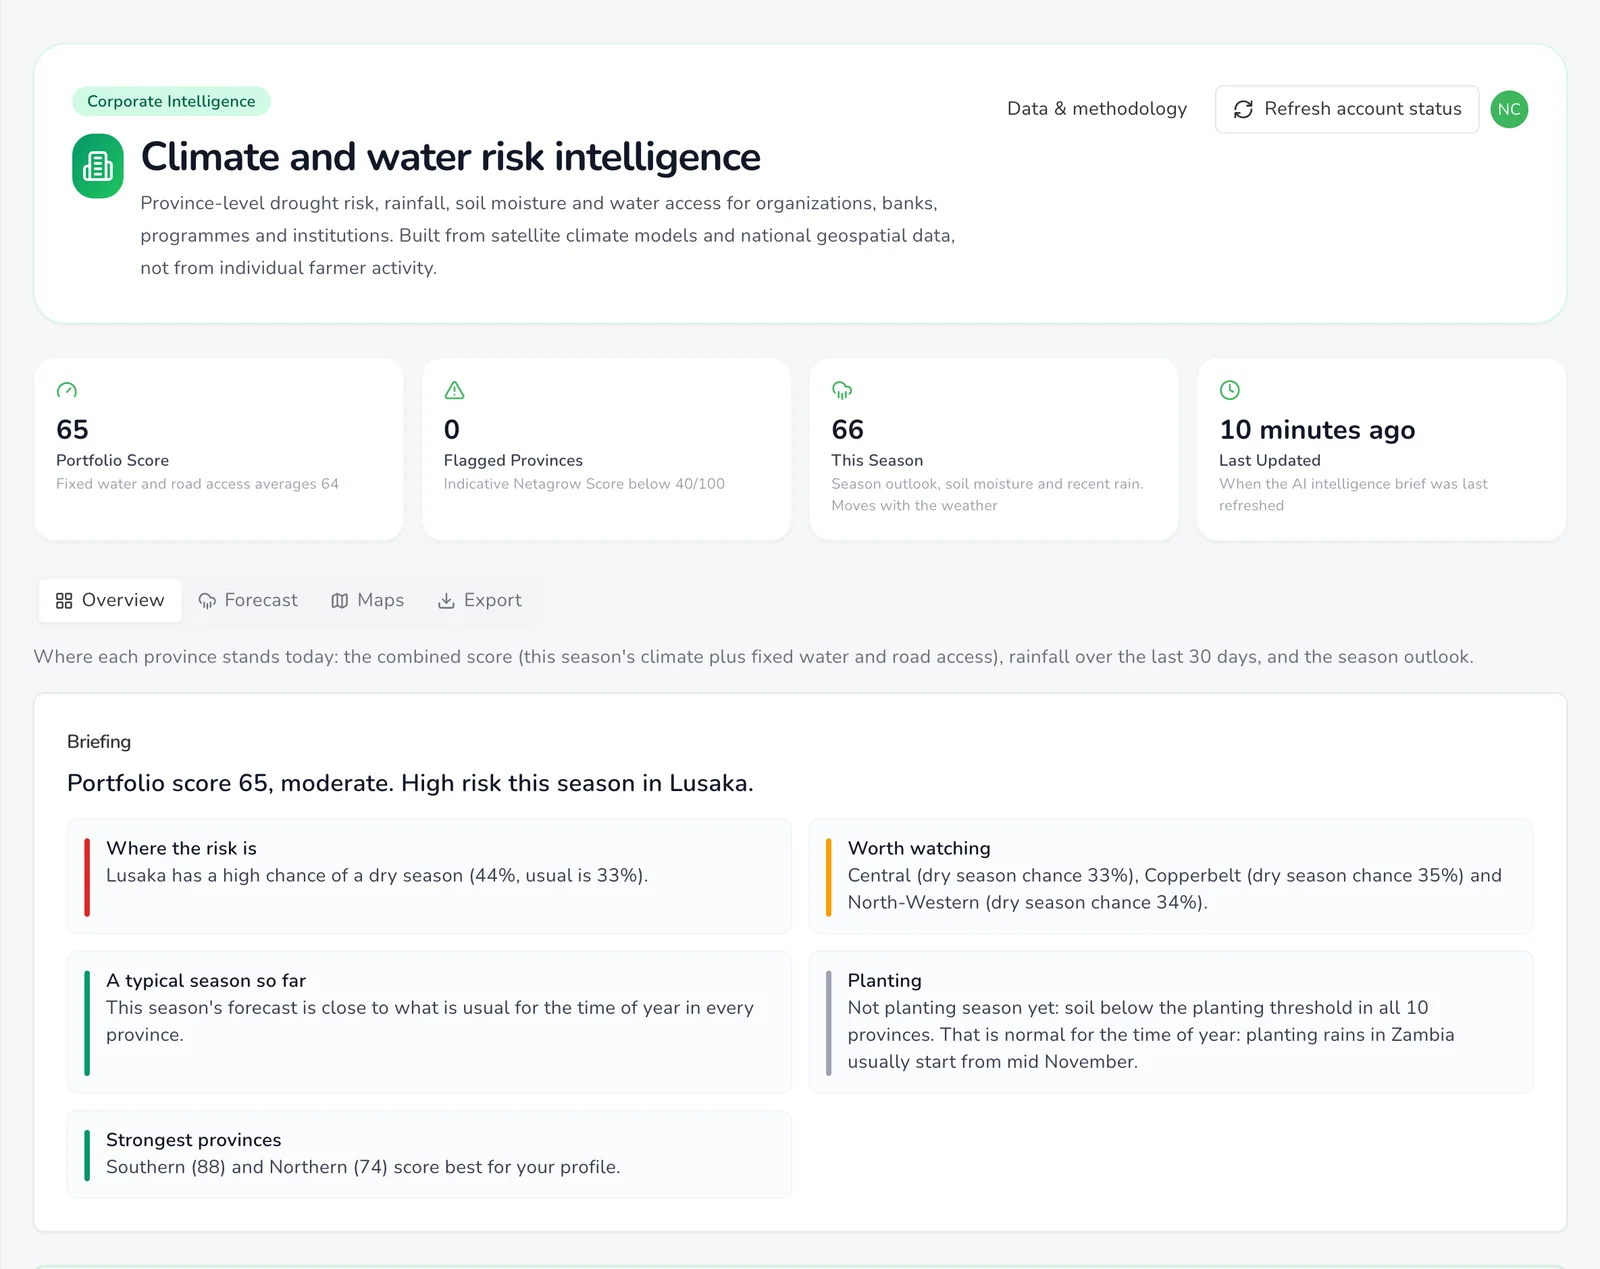
Built on data that covers the tropics; deployed in Zambia (all 10 provinces) as our first market. Operating elsewhere in Africa? Talk to us — the underlying archive already covers your region, we build out the regional layer per engagement.
10
provinces, every one scored
5 days
between satellite updates
40 years
of satellite rainfall history
4
decision profiles: lender, insurer, NGO, agribusiness
The data
Independent sources you can check.
Satellite rainfall and soil moisture
TAMSAT (University of Reading): rainfall for every 5-day period since the 1980s, and soil-moisture ensemble forecasts. Averaged over each province’s real boundary.
Seasonal outlook
The Copernicus seasonal forecast (ECMWF SEAS5) weights the soil-moisture outlook, so the season forecast reflects this year, not just history.
National geospatial data
Zambia’s national spatial data: boreholes, water bodies, aquifers, catchments and roads, maintained by government, not modelled by us.
Netagrow’s farmer network
What farmers on Netagrow grow, by province. Province totals only, and hidden where fewer than 20 farmers report.
Inside the dashboard
From a national picture to the reason behind one province’s score.
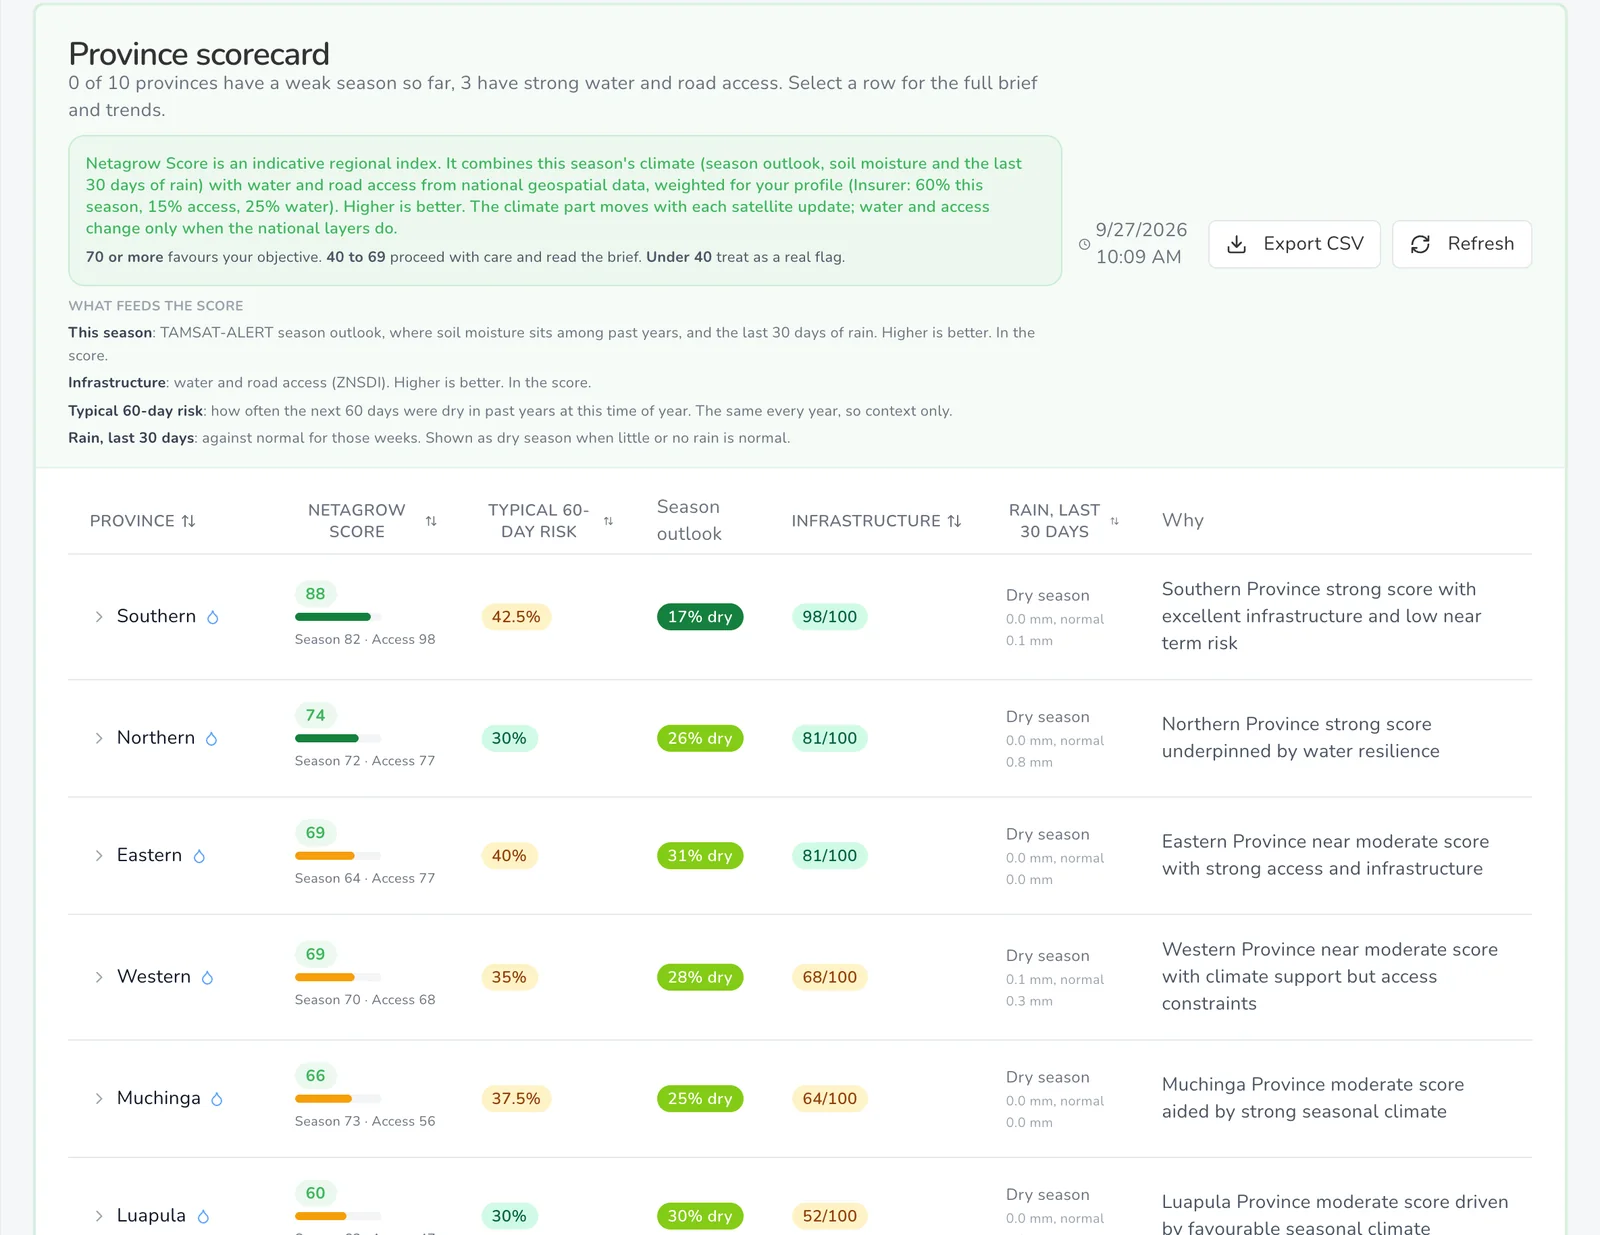
Scorecard
Every province, ranked for your objective.
One Netagrow Score per province, weighted to the way you decide: a lender, an insurer, an NGO and an agribusiness each get their own weighting of the same evidence.
- This season’s climate, plus fixed water and road access
- The typical 60-day dry risk and the last 30 days of rain beside it
- A plain-language reason on every row; export to CSV
Season forecast
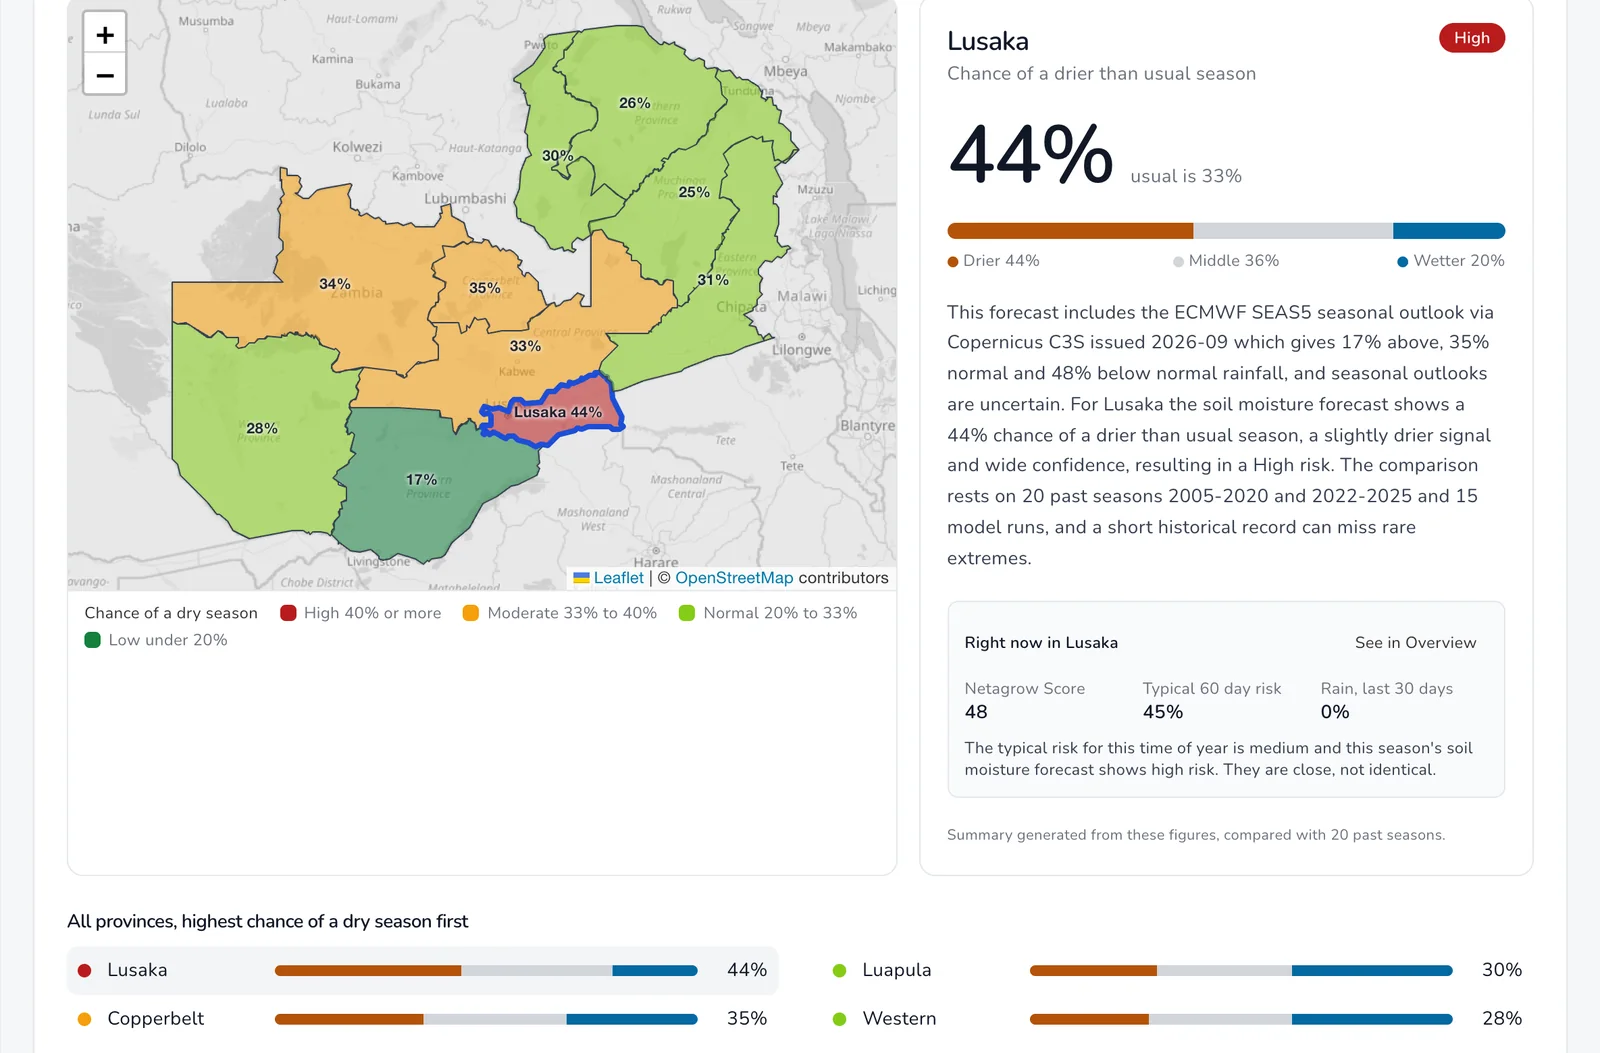
See which provinces are heading for a dry season.
The chance of a drier-than-usual season for each province, from a soil-moisture forecast that includes the latest seasonal outlook. Click a province for the full read.
- Drier, middle and wetter chances, against what is usual
- Updated as new forecasts are issued
- Stated confidence, and what the forecast can miss
Maps
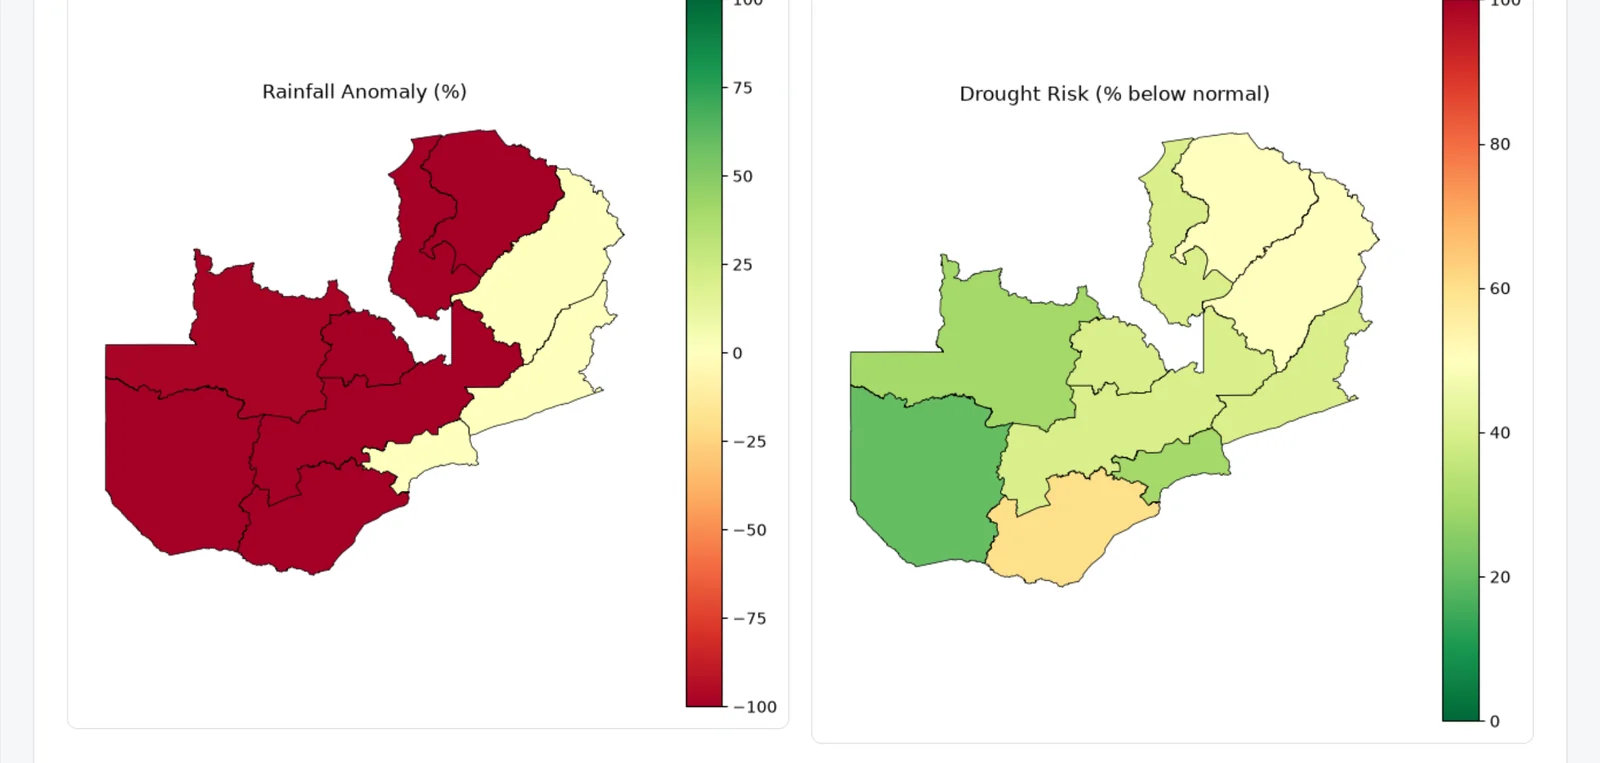
Rainfall and drought risk on one national map.
Satellite composites for rainfall anomaly and drought risk, plus an interactive map with the Netagrow Score, season outlook, water security and access layers.
- All 10 provinces, refreshed every 5 days
- Switch layers without leaving the page
- The province you select follows you across tabs
Use cases
What institutions actually do with this.
Bank / Lender
Before approving a K2M agri-loan portfolio in Southern Province, check 60-day drought risk and water infrastructure resilience for the district.
Insurer
Price crop insurance premiums using province-level drought probability instead of flat regional rates.
NGO / Development Org
Target drought-relief programming to the provinces actually forecast at risk, not last year's numbers.
Agribusiness
Decide where to place input-distribution depots based on water access and road infrastructure, not guesswork.
Who it serves
Institutional teams across agriculture.
Transparent Pricing
Flat monthly prices. No hidden fees.
Corporate
K1,200 per user/mo
- Netagrow Score, weighted to your persona
- Drought risk scorecard & AI-generated brief
- Climate, water & access map layers
- Soil moisture & rainfall trend history
- Drought risk forecast trajectory
Data API
From K12,000/mo
- Standard: K12,000/mo, 25,000 calls
- Professional: K25,000/mo, 100,000 calls
- Rainfall, drought risk, soil moisture, water, crop mix
- All 10 provinces, JSON over HTTPS
- Monthly invoice, bank transfer
Enterprise
From K40,000/mo
- Everything in Corporate and the Data API
- Quota and rate by agreement
- Independent soil-moisture forecast ensemble
- Proactive drought-risk email alerts
- White-label options
- Named contact & custom terms
Ready for institutional access?
Contact Netagrow to discuss Neta Alert tiers, integration, and data licensing.